» Articles for November 2016 Year

 
Sort articles by: Date | Most Rates | Most Views | Comments | Alphabet

ECharts a real estate sales customer funnel map

Author: bamboo06 on 28-11-2016, 02:59, views: 4244

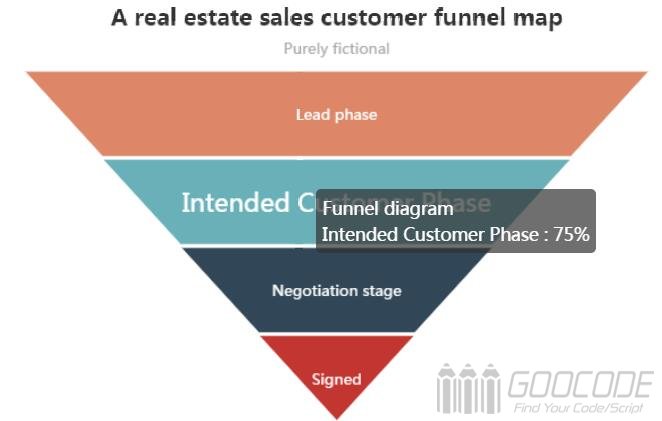
9 Funnel diagram for business processes more standardized, long cycle, links and more process analysis, through the funnel of all aspects of business data comparison, to visually identify and explain the problem. In the e-commerce website analysis, usually used for conversion rate comparison, it can show the user from entering the site to achieve the final conversion rate of purchase. In CRM, the customer sales funnel chart is used to show the customer conversion comparisons at each stage.
ECharts a real estate sales customer funnel map

This paper demonstrates the use of Echarts examples of the sale of a real estate customer funnel plot, through the funnel chart to visually demonstrate the conversion rate of each stage. For the sales process to produce four stages of customer types, such as potential customers - the intention of customers - the negotiation phase - signing. The four stages of data will be a funnel-shaped. Another simple description is that there are 100 customers to see real estate, and ultimately have 20 contract to buy, and the remaining 80 may have to look at some of it, some want to buy but for some reason to give up the purchase.
Category: Javascript / HTML5 / Plugins


ECharts Dashboard

Author: bamboo06 on 28-11-2016, 02:35, views: 44183

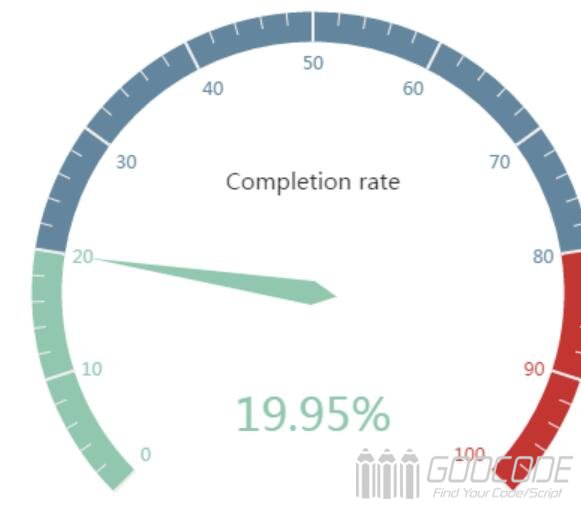
0 We often see the dashboard, such as the cockpit in the dashboard, the use of Echarts produced dashboard can easily display the user's data, clearly see the value of a range of indicators, dashboard forms of reporting applications in a variety of In the statistical system, this paper explains the application of the instrument panel in the completion rate of sales tasks.
ECharts Dashboard

First introduce Echarts, and then place the place where you need to add div # myChart, while adding it to the width and height properties.

Category: ---


ECharts, a pure Javascript charting library

Author: bamboo06 on 28-11-2016, 02:18, views: 3356

0 ECharts is a HTML5 Canvas, pure javascript-based charting library. It can run smoothly on PC and mobile devices, compatible with the current most browsers (IE8 / 9/10/11, Chrome, Firefox, Safari, etc.), providing intuitive, vivid, interactive, highly customizable Data Visualization Chart.
ECharts, a pure Javascript charting library

ECharts provides general line charts, histograms, scatter charts, pie charts, K charts, box charts for statistics, maps for geodata visualization, thermograms, line graphs, relational data visualization Treemap, parallel coordinates for multidimensional data visualization, funnel diagrams for BI, dashboards, and mashups between graphs and graphs.

Category: Javascript / HTML5 / Plugins


You can enter or drop-down the selected select

Author: bamboo06 on 22-11-2016, 00:35, views: 8716

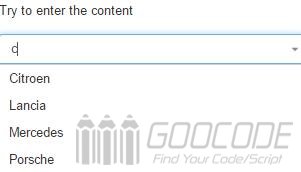
21 We know that the general select drop-down box is only selected, can not be used to enter the content. Sometimes we will encounter the drop-down box does not have to select the information item or drop-down options for a long time, we can let select into text, allowing users to enter the desired content, but also can be included in the importation of key words Also listed for quick selection.
You can enter or drop-down the selected select

Category: Javascript / CSS / Plugins


Use CSS3 to realize breadcrumb navigation and multi-step instructions

Author: bamboo06 on 22-11-2016, 00:11, views: 12011

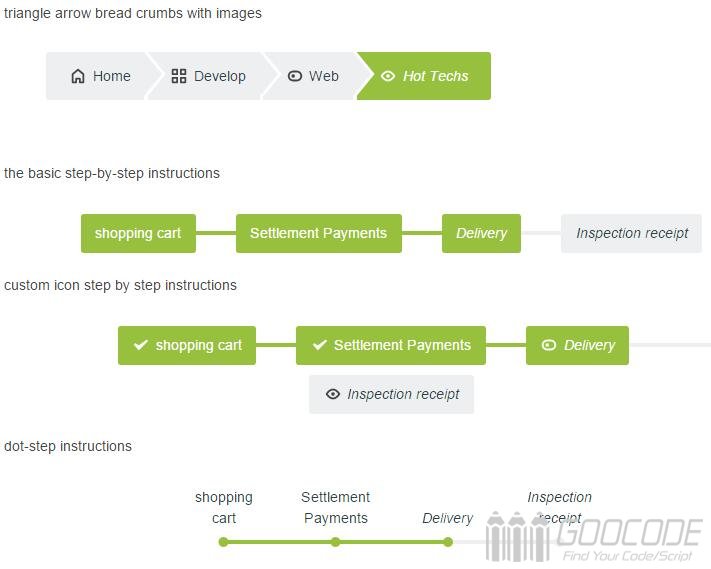
8 Breadcrumbs are used to navigate the site where the current page is located. The breadcrumbs represent site classification or directory hierarchy relationships, and multi-step instructions are often used in some step-by-step process wizards, such as step- Goods Order Process. Today we are using CSS to make breadcrumbs and multi-step instructional applications.
Use CSS3 to realize breadcrumb navigation and multi-step instructions

Category: CSS / Plugins