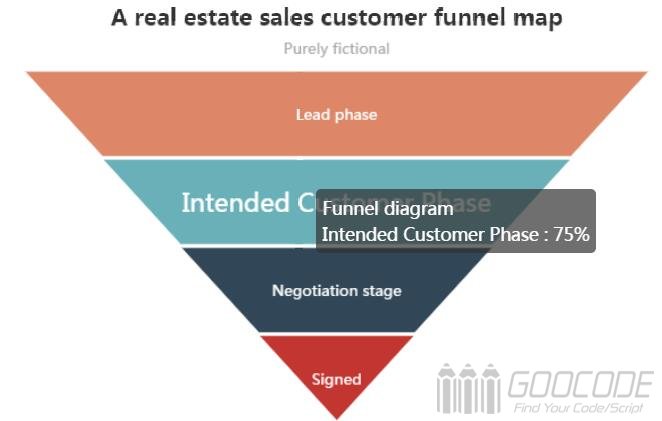
This paper demonstrates the use of Echarts examples of the sale of a real estate customer funnel plot, through the funnel chart to visually demonstrate the conversion rate of each stage. For the sales process to produce four stages of customer types, such as potential customers - the intention of customers - the negotiation phase - signing. The four stages of data will be a funnel-shaped. Another simple description is that there are 100 customers to see real estate, and ultimately have 20 contract to buy, and the remaining 80 may have to look at some of it, some want to buy but for some reason to give up the purchase.
HTML
The old rules, first of all, the introduction of Echarts, and then placed in the place where the need to add div # myChart, while adding width and height attributes.
<script src="echarts.min.js"></script>
<div id="myChart" style="width: 600px;height:400px;"></div>
javascript
Now to initialize the echarts instance, and then set options, and finally render the image.
// Initializes the echarts instance based on the prepared dom
var myChart = echarts.init(document.getElementById('myChart'));

option = {
    title : {
        text: 'A real estate sales customer funnel map',
        subtext: 'Purely fictional',
		left: 'center'
    },
    tooltip : {
        trigger: 'item',
        formatter: "{a} <br/>{b} : {c}%"
    },
    legend: {
		bottom: 10,
		left: 10,
		orient: 'vertical',
        data : ['Potential customer stage', 'intention customer stage', 'negotiation stage', 'signing']
    },
    //calculable : true,
    series : [
        {
            name:'Funnel diagram',
            type:'funnel', //Funnel diagram
            left: '10%',
            top: 60,
            //x2: 80,
            bottom: 60,
            width: '80%',
            // height: {totalHeight} - y - y2,
            min: 0,
            max: 100,
            minSize: '0%',
            maxSize: '100%',
            sort : 'descending', //Data sort, if it is: ascending, it is a pyramid
            gap : 2, //Data image spacing
            label: {
                normal: {
                    show: true, //The Text tab is displayed
                    position: 'inside' //Built-in graphic text labels, outside is outside, there left, right, inner, center
                },
                emphasis: {
                    textStyle: {
                        fontSize: 20
                    }
                }
            },
            labelLine: { //Sets the guideline that appears when the text label position is left or right
                normal: {
                    length: 10, //length
                    lineStyle: {
                        width: 1, //Line width
                        type: 'solid' //Type: implementation, and dotted lines: dashed and dotted
                    }
                }
            },
            itemStyle: { //Image Style
                normal: {
                    borderColor: '#fff', //Stroke color
                    borderWidth: 1  //Stroke width
                }
            },
            data:[ //Content data
                {value:25, name:'Signed'},
                {value:50, name:'Negotiation stage'},
                {value:75, name:'Intended Customer Phase'},
                {value:100, name:'Lead phase'}
            ]
        }
    ]
};
// Use the configuration item and data you just specified to display the chart.
myChart.setOption(option);
Legend is the legend, we put the legend on the lower left, vertical display four different stages (with different colors) of the legend. When setting the series, the parameter type is set to 'funnel' meaning the funnel map, the parameter sort can be set funnel map is inverted (descending) or pyramid-shaped (ascending). For the data in the funnel, in this case is set directly, the actual application, you may need to get from the back-end json data.

