» » funnel

 
Sort articles by: Date | Most Rates | Most Views | Comments | Alphabet

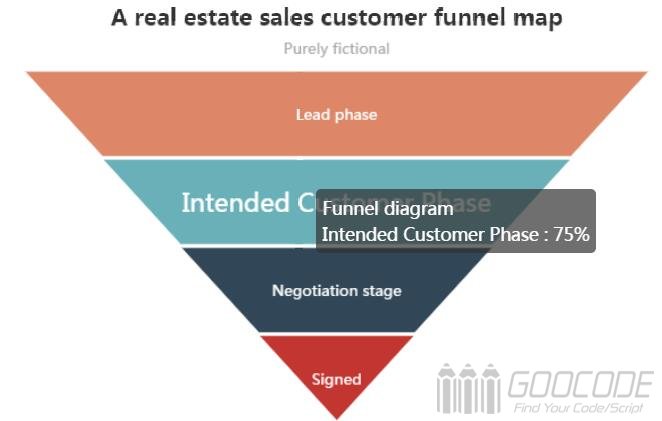
ECharts a real estate sales customer funnel map

Author: bamboo06 on 28-11-2016, 02:59, views: 4246

9 Funnel diagram for business processes more standardized, long cycle, links and more process analysis, through the funnel of all aspects of business data comparison, to visually identify and explain the problem. In the e-commerce website analysis, usually used for conversion rate comparison, it can show the user from entering the site to achieve the final conversion rate of purchase. In CRM, the customer sales funnel chart is used to show the customer conversion comparisons at each stage.
ECharts a real estate sales customer funnel map

This paper demonstrates the use of Echarts examples of the sale of a real estate customer funnel plot, through the funnel chart to visually demonstrate the conversion rate of each stage. For the sales process to produce four stages of customer types, such as potential customers - the intention of customers - the negotiation phase - signing. The four stages of data will be a funnel-shaped. Another simple description is that there are 100 customers to see real estate, and ultimately have 20 contract to buy, and the remaining 80 may have to look at some of it, some want to buy but for some reason to give up the purchase.

Category: Javascript / HTML5 / Plugins